Data logging is the quickest way to improve your speed for both the car set up and to improve as a driver. It can lead you directly to where & why you are fast or slow.Not all data logging hardware & software is created equal – the thing now to realise is that a good data analysis software package worth its salt will truly turbo charge the information logged and the right hardware is needed to be able to log at the required rates & amounts.
So what is this data logging all about??It is a method of recording what is happening to the vehicle as it is being used.Sounds simple enough, but this actually turns out to be a very useful thing to liberate speed by giving direction on how to improve the car set up and the driver, and as a bonus help look after the drive train by spotting problems before serious damage happens.
Without this recording we are having to rely on the drivers memory about what happened, which turns out is not that good ( I have many anecdotes on this!), and that memory has no hope of matching the literally hundreds of channels of information that a data logging can offer.
The data logging system is formed by two aspects, the hardware that gathers & records the information and the analysis software that allows us to view, interpret and evaluate the information the hardware has recorded. The quality of both have a big impact on how effective the process is.None of our customers have ever regretted investing in quality data logging and have often lamented not doing it earlier!
Hardware generally falls into two types, on board the engine control ecu, or part of a dash display system like Motecs range of displays which are available as a display only or can have data logging activated at any time for a one of cost. Life Racing engine ecu’s include very powerful on board data logging along with very capable and advanced analysis software so make a great choice, especially when used with the likes of a Motec dash display that can send its GPS & laptime information to the Life ecu via CAN bus. Other brands may offer lots of logging memory (often at painful download speeds) but do not have the tools in the analysis software to allow anything meaningful in the extraction of speed & laptime. Still useful though to keep an eye on the health of the drive train. And there are other brands again whos offerings are truly dreadful to the point that its not even worth downloading the data.
Data logging – Analysis SoftwareThe process of interpreting the data has been described as mining for nuggets of speed.Thats a fair enough analogy, to expand that analogy you can pick up a few grains with a simple gold pan, but with a gold dredge you can haul in lots of big nuggets. So like most things investing in a quality capable system will yield the best results.
So what functions should our analysis software should include to maximum mining power?
Firstly it needs to generate a distance channel. To be able to meaningfully do performance analysis we need distance as the x-axis for our display graphs as opposed to time. This way we are comparing events at the same point on the track or course.
Next we need the software to allow over laying of data from other sessions and from laps within the same session. Once we can start comparing things much insight comes.We also need the software to be able to generate track maps or course maps. These will include an indicator of current vehicle position correlated to the cursor position on the data. This makes finding our way around the data much easier & comprehensible.
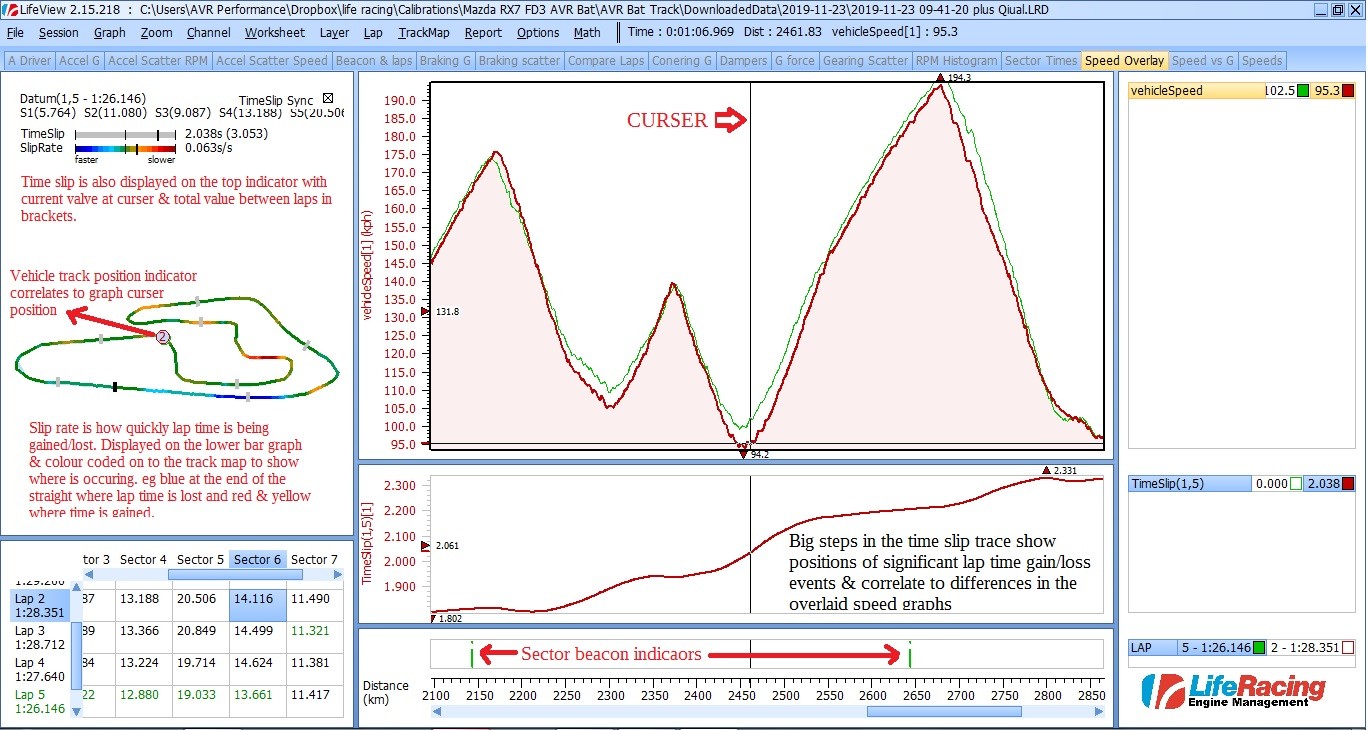
The software needs to be able to brake the data up into laps using laptime beacon information from the data and include a facility to manually inset start/finish beacons for the likes of rally or sprint applications. The software also needs to be able to generate the likes of time slip channels to quickly highlight where time is gained or lost when comparing laps. And include a method of generating sectors & sector times within the lap which allows another method of honing in where on the track time is gained or lost and also highlight driver consistency.
Below is a Life Racing LifeView screen shot that highlights the above with some additional notes.
So what is this data logging all about??It is a method of recording what is happening to the vehicle as it is being used.Sounds simple enough, but this actually turns out to be a very useful thing to liberate speed by giving direction on how to improve the car set up and the driver, and as a bonus help look after the drive train by spotting problems before serious damage happens.
Without this recording we are having to rely on the drivers memory about what happened, which turns out is not that good ( I have many anecdotes on this!), and that memory has no hope of matching the literally hundreds of channels of information that a data logging can offer.
The data logging system is formed by two aspects, the hardware that gathers & records the information and the analysis software that allows us to view, interpret and evaluate the information the hardware has recorded. The quality of both have a big impact on how effective the process is.None of our customers have ever regretted investing in quality data logging and have often lamented not doing it earlier!
Hardware generally falls into two types, on board the engine control ecu, or part of a dash display system like Motecs range of displays which are available as a display only or can have data logging activated at any time for a one of cost. Life Racing engine ecu’s include very powerful on board data logging along with very capable and advanced analysis software so make a great choice, especially when used with the likes of a Motec dash display that can send its GPS & laptime information to the Life ecu via CAN bus. Other brands may offer lots of logging memory (often at painful download speeds) but do not have the tools in the analysis software to allow anything meaningful in the extraction of speed & laptime. Still useful though to keep an eye on the health of the drive train. And there are other brands again whos offerings are truly dreadful to the point that its not even worth downloading the data.
Data logging – Analysis SoftwareThe process of interpreting the data has been described as mining for nuggets of speed.Thats a fair enough analogy, to expand that analogy you can pick up a few grains with a simple gold pan, but with a gold dredge you can haul in lots of big nuggets. So like most things investing in a quality capable system will yield the best results.
So what functions should our analysis software should include to maximum mining power?
Firstly it needs to generate a distance channel. To be able to meaningfully do performance analysis we need distance as the x-axis for our display graphs as opposed to time. This way we are comparing events at the same point on the track or course.
Next we need the software to allow over laying of data from other sessions and from laps within the same session. Once we can start comparing things much insight comes.We also need the software to be able to generate track maps or course maps. These will include an indicator of current vehicle position correlated to the cursor position on the data. This makes finding our way around the data much easier & comprehensible.
The software needs to be able to brake the data up into laps using laptime beacon information from the data and include a facility to manually inset start/finish beacons for the likes of rally or sprint applications. The software also needs to be able to generate the likes of time slip channels to quickly highlight where time is gained or lost when comparing laps. And include a method of generating sectors & sector times within the lap which allows another method of honing in where on the track time is gained or lost and also highlight driver consistency.
Below is a Life Racing LifeView screen shot that highlights the above with some additional notes.
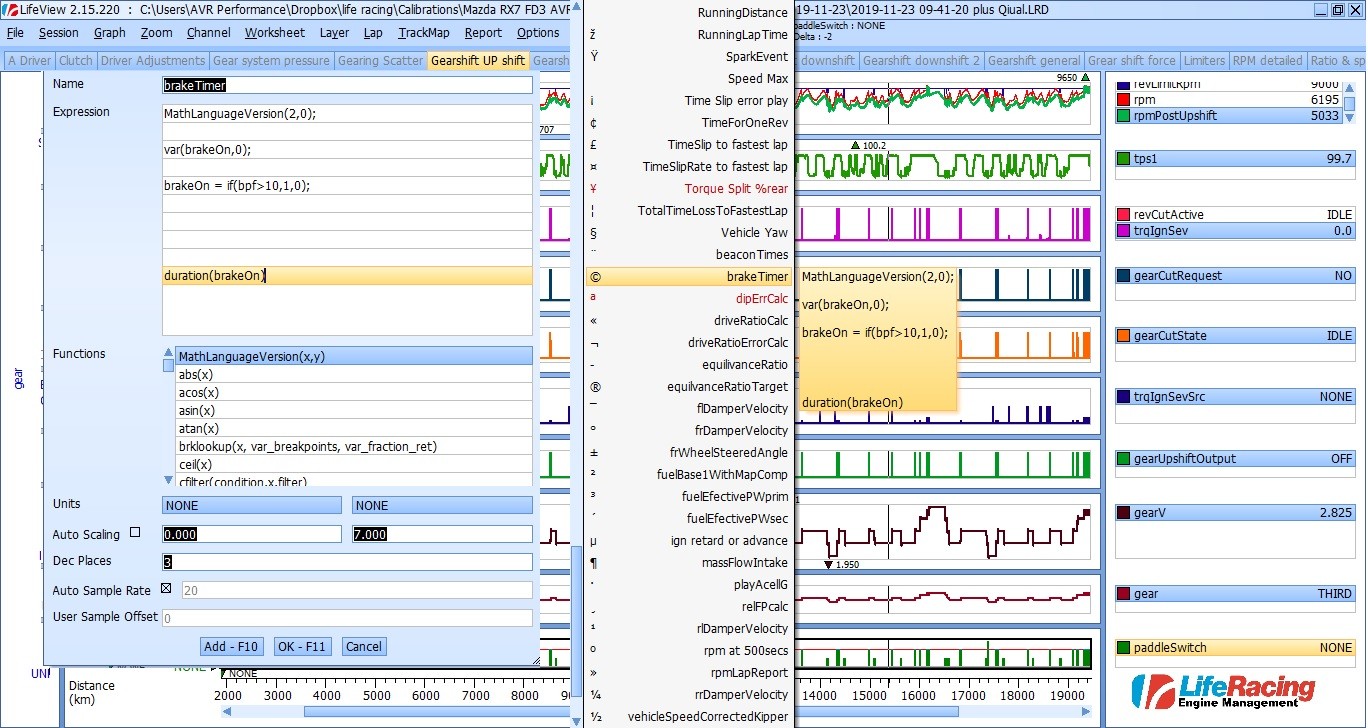
Next we need the software to have a comprehensive maths package. This will allow us to manipulate the logged channels to create new information that we could not see from the logged information alone. A simple example of this is generating a brake bias channel from the logged front & rear brake pressure channels.
A good maths package will include simple mathematical operators like addition & multiplication through to logical operators, numerical analysis and statistical analysis.This also allows some simulation to be done for the likes of alternative gearing and suspension setups (eg the effect on the balance of the car with alternative springs & bars).
A good maths package will include simple mathematical operators like addition & multiplication through to logical operators, numerical analysis and statistical analysis.This also allows some simulation to be done for the likes of alternative gearing and suspension setups (eg the effect on the balance of the car with alternative springs & bars).
Many logging set ups we have done are logging four or five hundred channels of information (& some more!) just from the logged channels alone. Add all of the extra channels from the maths functions and it becomes obvious we need a way of organising how we display the data in a logical way & be able to go straight to an item of interest. Good systems like Life Racings LifeView & Motecs i2 Pro organise the layouts into general areas of interest in a user customizable way in the form of Workbooks. Within these Workbooks there are individual customizable work sheets which represent a “single screen” of a display layout. So we might for example have a series of Workbooks for drivetrain health, braking, Lap time performance, cornering performance, forward acceleration, suspension dynamics, gearshifting & so on. Then we arrange a series of worksheets within each Workbook to further breakdown that area of interest & display the relevant information in different ways.
A large proportion of data mining time is spent in the channel graphs where the logged items we are looking at are displayed verses distance. A good software package will also offer other methods of displaying the data to expand our insight, these include;
Scatter Plots;Here one channel forms the x-axis and another channel forms the y-axis. An example is shown below of a screen shot from Motec i2-Pro of a “traction circle” scatter plot. Here lateral G-force forms the x-axis and longitudinal G-force forms the y-axis. Scatter plots are an excellent way for getting an overall view of various characteristics, showing trends and allowing additional information to come to light that might not be obvious from a traditional graph trace.
Scatter Plots;Here one channel forms the x-axis and another channel forms the y-axis. An example is shown below of a screen shot from Motec i2-Pro of a “traction circle” scatter plot. Here lateral G-force forms the x-axis and longitudinal G-force forms the y-axis. Scatter plots are an excellent way for getting an overall view of various characteristics, showing trends and allowing additional information to come to light that might not be obvious from a traditional graph trace.
.jpg)
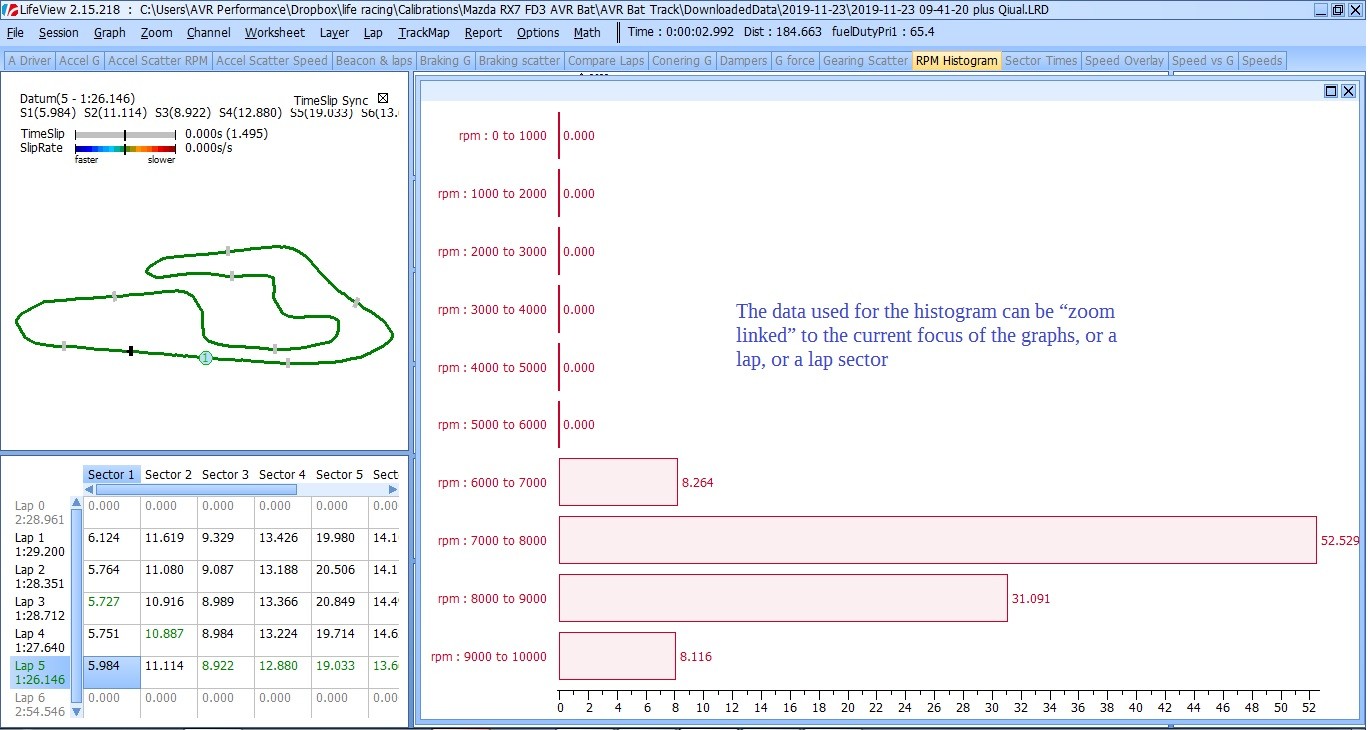
Histograms;These present the data for a channel in a form that displays a percentage of how much time is spent in various ranges of that channel. Common examples include rpm, throttle and vehicle speed. The data used for the histogram is “zoom linked” to either the zoom level on that data graphs, a lap, a sector of a lap or the whole session. The screen shot below shows rpm for a sector. The rpm example is a great way to quickly see if the driver is keeping the engine in its best operating range and the gearing is allowing that to happen.
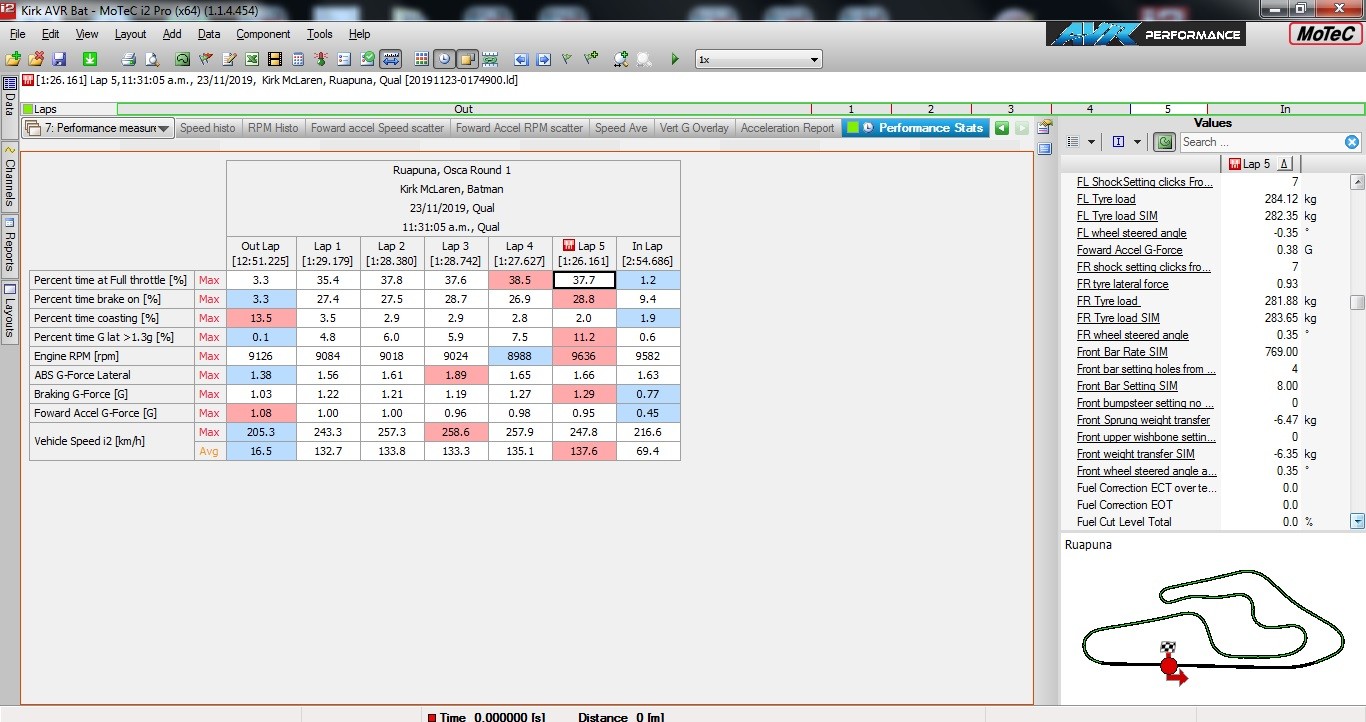
Statistics;Good software will include ways of displaying statistical analysis in a range of tables for easy access to the information. Common items include minimums, maximums, averages and standard deviations for individual channel items including maths items. The data used for the statistics will also be “zoom linked” to the zoom level on the data graphs, a lap, a sector of a lap or the whole session. In the example below there are the items percentage time braking, percentage time full throttle and percentage time coasting to help the driver make sure these are optimum & consistent lap to lap and sector to sector. The percentage time coasting is when the throttle is closed & there are no brakes applied – we want this to be as close to zero as possible.
Rainbow MapsHere colour coding is applied to a track map to represent where on the track different values of a channel occurred. This gives a quick way to evaluate where on the track events occurred. For example in the screen shot below we have used the longitudinal G-force channel to evaluate how the driver is utilizing the brakes. At a glance we can see where the brakes were applied, how deeply into the corners trail braking was used & the levels of braking forces during the brake event.
.jpg)
Naturally the data analysis package will need setting up to maximise and leverage the above and to suit your application & sensor package. Autosport Technology has close on two decades experience doing this & have developed many techniques & tricks along the way.
We can offer hardware & sensor installation, software set up as well as remote & track side support for down loading & interpreting/evaluating the data. We can also offer tuition in how to interpret/evaluate the data your self.Feel free to call to see how our services can maximise your data analysis package.
We can offer hardware & sensor installation, software set up as well as remote & track side support for down loading & interpreting/evaluating the data. We can also offer tuition in how to interpret/evaluate the data your self.Feel free to call to see how our services can maximise your data analysis package.